Print Version
Introduction
About the Module
Short-term weather forecasting classically works in the one- to seven-day time frame. However, large-scale and widespread flooding does not result from a single weather event that can be covered by a short-term forecast. Rather, it comes from persistent rainfall over a catchment region during an entire rainfall season, which saturates the ground and leaves areas susceptible to flooding. This means that forecasters should have a comprehensive understanding of the atmospheric and ground surface environment at all times and be able to incorporate information about current surface conditions in their short-term weather forecasts.
This module examines a variety of meteorological and hydrological products that can improve the quality of heavy rainfall forecasts and assist with hydrological management during extensive precipitation events. Some of these are meteorology products that forecasters typically use, such as satellite imagery, numerical weather prediction products, and radar data (when available). But there are a host of new satellite-based hydrological products that are available to forecasters and provide critical information about ground surface conditions. We will introduce several soil moisture products (ASCAT, SMOS, and ASAR GM), and the hydro-estimator, which provides precipitation estimates. The products will be presented within the context of a case, the flooding of South Africa's Vaal Dam in 2009/2010. (Note to learners outside South Africa: The term "dam" refers to man-made accumulations of water behind a barrier. This is called a "reservoir" in some places. The barrier itself is called the" dam wall.")
The module is intended for operational forecasters. Meteorology students and weather enthusiasts should also find the material useful.
By the end of the module, learners should be able to do the following:
- Explain why it is important for weather forecasters to have a holistic understanding of meteorological and hydrological conditions at all times
- Describe the benefits of combining data from different meteorological and hydrological sources when dealing with heavy rainfall situations that can potentially lead to flooding
- Describe the hydro-estimator and the ASCAT, SMOS, ASAR GM soil moisture products and the benefits of using them in the forecast process
- Describe the importance of communicating with hydrological management when heavy rainfall and flooding are a concern
To get the most out of this module, learners should have a basic understanding of meteorology, forecasting, and hydrology. For information about hydrology, see The COMET® Program’s online international hydrology course at https://www.meted.ucar.edu/training_course.php?id=24. Note that COMET modules are free and available to all users but require registration.
Flooding in South Africa
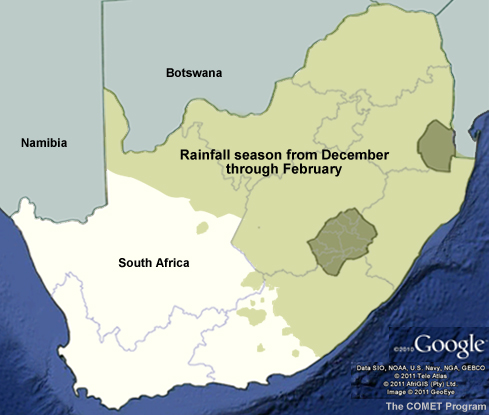
South Africa receives rainfall from cold fronts and other mid-latitude weather systems as well as tropically sourced moisture and resultant precipitation during the Southern Hemispheric summer months (October to March).
The central and northern parts of South Africa (the summer rainfall region) can receive up to 30% of their October to December rainfall totals and 60% of their January rainfall total from tropical temperate troughs alone, making them the single most important system for rainfall contribution for this region. For more information on tropical temperate troughs, access the COMET module Introduction to Tropical Meteorology at http://www.meted.ucar.edu/tropical/textbook_2nd_edition/navmenu.php .
The South African Weather Service (SAWS) issues now-casts for flash flooding and localized flooding along with heavy rainfall warnings when more than 50 mm of rainfall are expected over a 24-hour period. Early warnings for flash flooding are issued as heavy rainfall warnings with “the potential for flash flooding.” These forecasts are based on real-time satellite and radar imagery along with numerical weather prediction (NWP) model forecasts. Until recently, they did not include information about the actual state of river basins or areas prone to flash flooding. But SAWS and the National Disaster Management Centre (NDMC) are now operating South Africa’s first operational flash flood warning system, known as the South African Flash Flood Guidance (SAFFG) system. The system incorporates meteorological and hydrological data and lets SAWS issue flash flood warnings to disaster management structures and the public.
About the Case
The case covers the flooding of South Africa’s Vaal Dam during the 2009/2010 summer rainfall season. As you will see, the extensive flooding resulted from the accumulation of rainfall over the catchment area, rather than a single weather event. The seasonal forecast had, in fact, predicted an El Niño event, which usually results in below-average rainfall amounts for the summer rainfall region. But almost all of the rainfall areas across South Africa recorded near-normal or above-normal rainfall from November 2009 through January 2010.
Before we begin the case, review this background information about the Vaal Dam.
The Vaal Dam lies on the Vaal River, one of South Africa's strongest-flowing rivers. The reservoir behind the dam covers an area over three hundred square kilometers and is South Africa's largest by area and third largest by volume. It lies in the Vaal Dam catchment, which is divided into the Upper Vaal, Middle Vaal, and Lower Vaal catchment regions. The Middle and Lower regions occur below the level of the dam wall and will not be considered in the case.
The Vaal River is the largest tributary of the Orange River and has its source in the Drakensberg Mountains in Mpumalanga east of Johannesburg (about 30 km north of Ermelo). The river then flows westwards to its junction with the Orange River southwest of Kimberley in the Northern Cape. The Vaal River is 1120 km in length and forms the border between the Mpumalanga, Gauteng, and the North West provinces on its north bank and the Free State on its south.
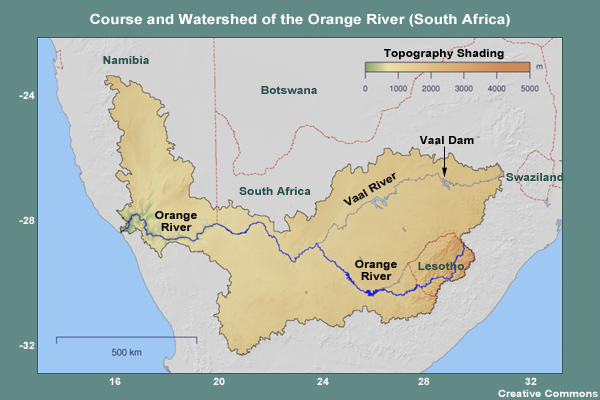
The Vaal Dam is a vital part of the water supply system for the Gauteng region. Water for the dam is supplied by the Vaal and Wilge Rivers. We will focus on the Vaal River inflow, which is in the Vaal River catchment area in the Mpumalanga Province.
Overview of the Rainfall and Flooding Season
Rainfall Accumulation Data
The South African Weather Service’s Climate Information Service provides rainfall accumulation data measured in mm in five-minute intervals, 24 hours per day. The raw data are averaged for each day, and monthly averages are provided for stations of interest. Graphs and maps are used to show the distribution of rainfall as well as rainfall totals versus seasonal averages. For more information about these data, contact the Climate Information Service at www.weathersa.co.za.
In this section, we will look at three types of rainfall data for the case: provincial seasonal rainfall graphs, provincial seasonal rainfall maps, and station rainfall maps.
Provincial Seasonal Rainfall Graphs
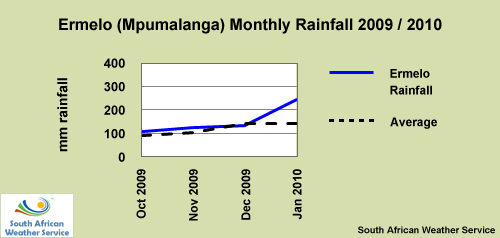
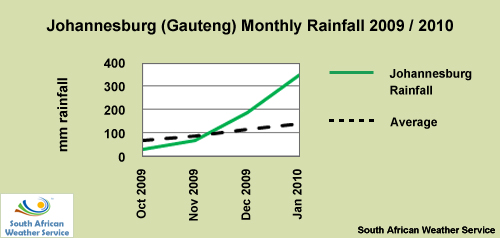
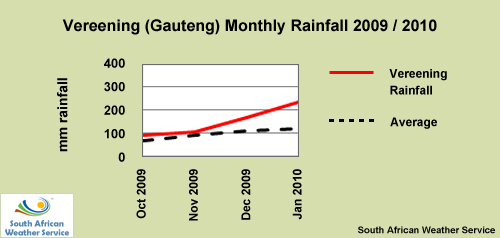
Here are the provincial seasonal rainfall graphs for the Mpumalanga and Gauteng Provinces from October 2009 to 21 January 2010. Compare the amounts measured against the climatologic averages, then answer the question below.

Based on the seasonal rainfall to date, which provincial areas might be at risk for rainfall-induced flooding in January 2010? Select all that apply, then click Done.
The correct answer is B.
Recent trends in Gauteng make flooding a possible concern, while Mpumalanga has experienced a shortage of rainfall over the past two months.
Provincial Seasonal Rainfall Map
Provincial seasonal rainfall graphs provide useful information about a region's rainfall but do not give a clear indication of where the major rain events actually occurred. For that, we will look at a provincial seasonal rainfall map from SAWS. Note that areas with above-average rainfall are likely to have wet soil conditions (high soil moisture values). These conditions reduce the ability of the ground to absorb additional rainfall.
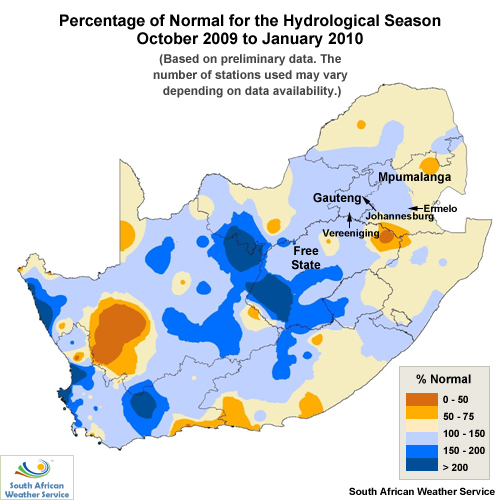
Forecasters should start being concerned about rainfall-induced flooding when rainfall reaches between 100 and 150%. According to these data, which areas are at risk of flooding? Select all that apply, then click Done.
The correct answers are B and C.
The regional map helps narrow our focus. All of Gauteng is at risk for flooding since it received between 100% and 150% of its average rainfall. Significant portions of Mpumalanga are at risk as well, with some areas receiving 100% to 150%. Some areas within Mpumalanga received below average rainfall, from 50% to 75%.
Station Rainfall Maps
Review the provincial seasonal rainfall graphs
Review the provincial seasonal rainfall map
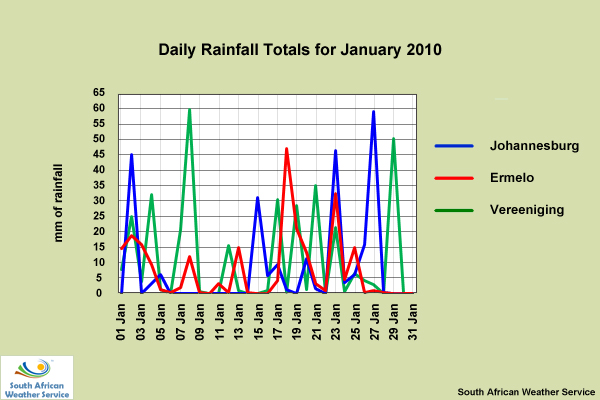
To gauge the likely impact of significant rainfall on hydrological conditions, it's important to know when the major rain events occurred. Were they spread out or clustered? Did they occur at the beginning or end of the season? To find this out, we'll look at actual rainfall graphs for the weather stations in Ermelo (Mpumalanga Province) and Johannesburg and Vereeniging (Gauteng Province).
Which statement is correct? (Choose the best answer.)
The correct answer is D.
As expected, rainfall rates increased at all three stations in January. But Johannesburg had the largest spike at the end of the period and is therefore at greatest risk of flooding should significant rain events occur. Note that the weather station rainfall records corroborate the data from the provincial seasonal rainfall map but not the provincial seasonal rainfall graph. For example, the graph showed a decrease in rainfall over Mpumalanga Province, while the Ermelo station rainfall map reported above average rainfall for the period. This highlights the importance of monitoring different types of data at different scales. You are far more likely to get an accurate picture of meteorological and hydrological conditions throughout your area of responsibility.
Combining Hydrological and Rainfall Data
Combined 7-Day Rainfall Accumulation vs. Dam Percent Capacity
The South African Department of Water Affairs (DWA) provides various hydrological data about the country's dams, including:
- Graphs of the relationship between rainfall accumulation and dam percent capacity
- Graphs of the real-time and predicted capacities of dams
For more information on DWA, visit http://www.dwaf.gov.za/.
We'll look at both types of data, the first one now, the second in a later section.
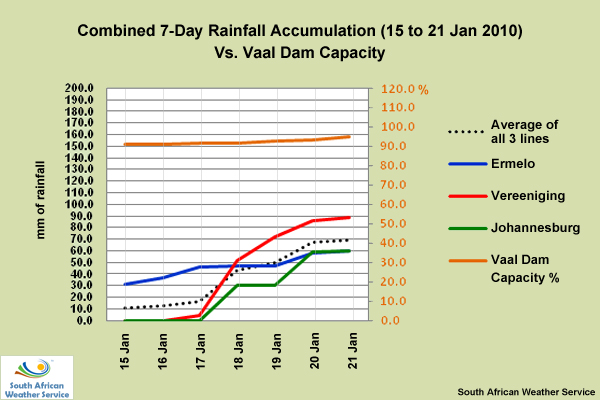
Here are the rainfall totals for the three stations compared to the percent capacity of the Vaal Dam from 15 to 21 January 2010. As you can see, the water level was at 90% capacity on 15 January and rose to 94% on 21 January. This was due, in part, to the continued increase in precipitation in the areas around all three weather stations. If precipitation continues, the levels will keep rising, making flooding an even more likely possibility. Keep in mind that there’s a time delay between an actual rain event and the water’s arrival at a dam. For the Vaal Dam catchment area, it takes approximately two days for rain at the furthest edge to arrive at the dam.
In the next section, we'll look at satellite, NWP, and radar data for 21 January 2010 and see if they indicate potential rainfall for the next days. Following that, we'll examine hydrological and rainfall data from late January and early February and see what actually happened to the Vaal Dam.
Satellite and NWP Data
Overview
Observations from the Meteosat Second Generation (MSG) satellites are available across the Southern African Development Community (SADC) and are an essential tool in weather forecasting. Many single channel and composite images and products are useful when heavy rainfall and flooding are a concern, particularly from the water vapour 6.2 µm and infrared 10.8 µm channels.
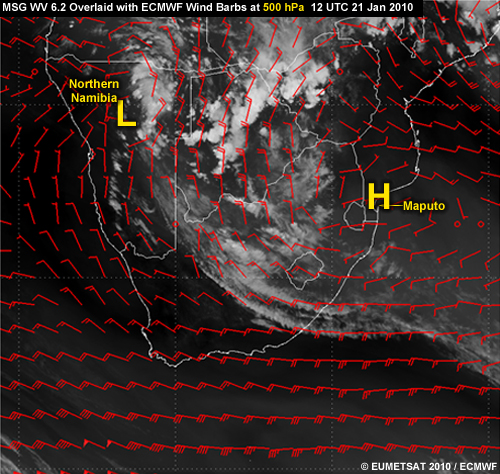
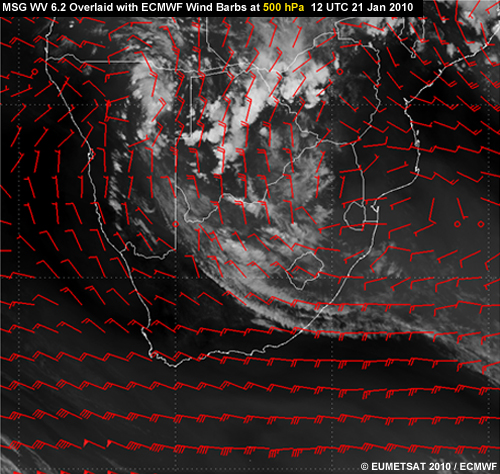
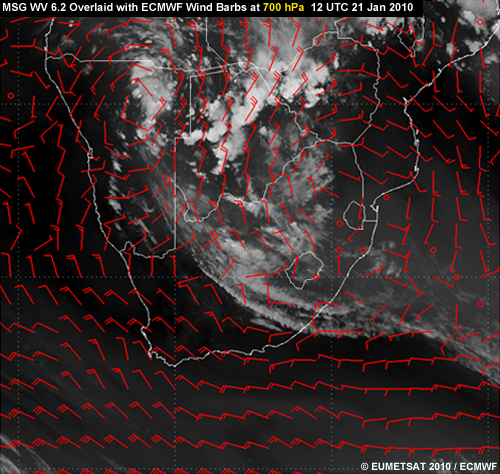
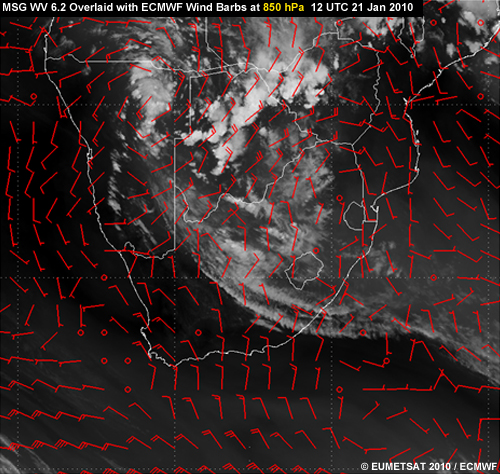
For the case, we'll examine MSG WV 6.2 µm channel images overlaid with ECMWF wind fields at 850 hPa, 700 hPa, and 500 hPa for 21 January 2010 at 12Z. The water vapour channel helps identify upper-level (400-hPa) moisture content and is particularly useful for locating upper-level cyclonic weather disturbances or upper-level lows. The wind barbs help us determine the location of the lows and, if any are present, identify their depth through the atmosphere, their intensity, and where the moisture is being drawn from to fuel any convective activity.
Throughout the following exercises, we'll refer to different parts of Southern Africa. If you're not familiar with the region, please refer to the "Southern Africa Maps" link to the left.
WV Imagery Overlaid with Model Wind Fields
Starting with 500 hPa, click each tab, review the image, and then answer the question below it. When you have finished all three questions, move on to the next page.
There's at least one 500-hPa high (anti-cyclonic) and low (cyclonic) on this image. Click each of these areas on the map. When finished, click Done.
There are two systems in the image: 1) a 500-hPa high over the Maputo area, and 2) a 500-hPa low over northern Namibia, which appears as more of a wave than a closed low. Scroll up to the top and click the 700-hPa tab.
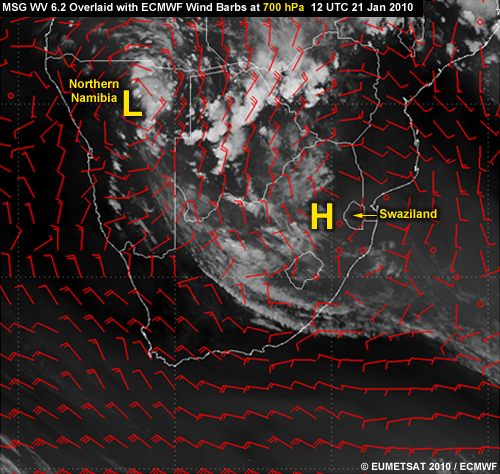
There's at least one 700-hPa low and high on this image. Click each of these areas on the map. When finished, click Done.
There are two systems in the image: 1) a 700-hPa high just west of Swaziland in the region of the anti-cyclonic flow, and 2) a 700-hPa low over northern Namibia in the region of cyclonic circulation. Now click the 850-hPa tab.
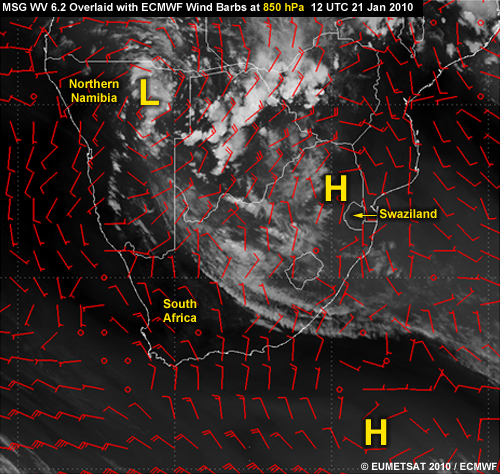
There's at least one 850-hPa low and high on this image. Click each of these areas on the map. When finished, click Done.
There are two systems in the image: 1) an 850-hPa high just west of Swaziland in the region of the anti-cyclonic flow, and 2) an 850-hPa low over northern Namibia in the region of cyclonic circulation. Click the next page button to proceed.
Upper-Level Low over Namibia
At what levels are the cyclonic systems over Namibia well developed? Review the data, then answer the question below.
Select the level(s) at which the cyclonic circulations over Namibia are well developed. When you are finished, click Done.
The correct answers are B and C.
There is a closed circulation at 850 hPa and 700 hPa, and a trough at 500 hPa.
Moisture Advection
From what direction is the moisture over Zambia and Botswana being drawn? Review the data, then answer the question below.
Select the dominant direction from which the moisture over Zambia and Botswana is being being drawn. Then click Done.
The correct answer is E.
The wind converging into the low/trough at all levels comes from the northeast. This is significant because it's bringing a warm tropical air mass into the area, making moisture available in a deep layer from 850 hPa to 500 hPa at least.
Comparing Cyclonic and Anti-Cyclonic Systems

Compare the position of the upper-level high to the east and the low over Namibia. Which region should experience maximum low-level convergence?
The correct answer is C.
The region at C should experience the most low-level convergence since it's between the two systems. Areas A and B are both divergent areas, where the low-level flow is moving in opposite directions.
Direction of the System
The three images show a great deal of moisture related to the convective activities over Zambia and Botswana. Towards what area is the moisture being driven? Review the data, then answer the question below.
Select the area towards which the moisture is being driven. Then click Done.
The correct answer is C.
At all three levels (850, 700, and 500 hPa), the winds have a strong northerly component over Zambia and Botswana. This is steering the humidity mainly to the central part of South Africa, putting it at risk for a considerable amount of rain. This assessment should be confirmed with forecast information from NWP models.
RADAR Rainfall Estimates
SAWS Radar
Radars can provide an indirect estimate of rainfall with high-resolution aerial coverage. Often rain gauges are used to calibrate radar rainfall estimates.
Due to the high cost of procuring and maintaining radars, they are a scarce commodity in most of Africa. However, they are available in South Africa. Until the end of 2009, the South African weather radar network consisted of ten C-band and two S-band radar systems located across the country. This network was used extensively to support weather predictions, storm identification, and aviation applications. Note some of the benefits and limitations of the system:
- Convective storms were observed very well given their relatively deep vertical dimensions; however, these systems could only be partially seen at long range due to the curvature of the Earth away from the radar beam
- The spacing of the radars made it difficult to observe stratiform rain; these systems are relatively shallow and radar beams overshoot the echo tops at long ranges
- The system lacked Doppler capabilities, which can detect the relative movement of rain and ice particles present in active clouds
As of 2010, SAWS is migrating to S-band radar systems in which the signals undergo far less attenuation than C-band signals. These radars have sensitive Doppler capabilities that can detect the internal wind structure of storms, enabling better nowcasting of severe storms. This new radar technology is also very useful for precipitation estimates.
For more information on radar rainfall, see the following COMET modules:
- Precipitation Estimates, Part 1: Measurements (see section 2), https://www.meted.ucar.edu/training_module.php?id=526
- Radar Signatures for Severe Convective Weather, http://www.meted.ucar.edu/radar/severe_signatures/
Radar Data for 21 January 2010
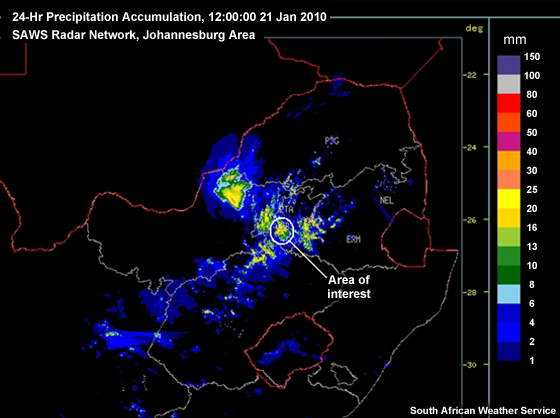
Here's the 24-hour rainfall accumulation data from the SAWS radar network for the Johannesburg area on 21 January 2010 at 12Z. What does it indicate about rainfall in the area over the past 24 hours?
The correct answer is C.
The radar rainfall accumulation indicates that 10 to 25 mm of rain on average fell over the Johannesburg area during the previous 24 hours, with 40 mm calculated locally. Note that the daily rainfall totals show different amounts: 10 mm were actually measured. This discrepancy is not unusual. Radar and rain gauges are different technologies and have distinct advantages and disadvantages.
Overview of the Rainfall and Flooding Season
Overview
Satellite estimates of rainfall, like radar, are indirect. Satellite rainfall estimates are lower-resolution than radar estimates but are more consistent from one location to another.
A common satellite tool, the hydro-estimator (HE), indicates how much rainfall (in mm) has accumulated over a given region during a specified period and is useful for determining whether to issue warnings for heavy rainfall and flash flooding. HE precipitation estimates are based on cloud-top temperatures derived from satellite imagery. This makes them a good complement to radar data. But the HE is particularly valuable in data-sparse areas with limited ground-based observing systems, such as the Southern African Development Community (SADC - see map).
The South African Weather Service has an in-house version of the hydro-estimator, which uses the local version of the UK Met Office Unified Model and MSG satellite data. The product can be visualised with the SUMO software and internally at the SWFDP website hosted by SAWS. (Note that it's for use by member countries only.)
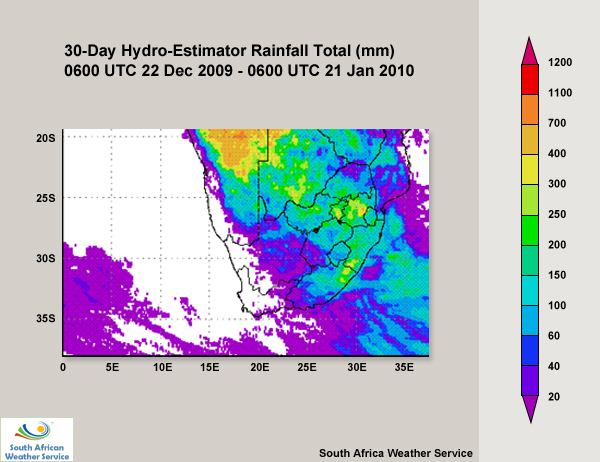
HE Data for 21 January 2010
The graphic shows accumulated rainfall based on the hydro-estimator over South Africa, Namibia, and Botswana from 22 December 2009 to 21 January 2010. Rainfall totals over the Mpumalanga and Gauteng Provinces are between 200 mm and 400 mm, while northern Namibia has accumulated values well above 300 mm.
How well do the HE data correlate with the seasonal rainfall data that we examined earlier? Review the data, then answer the question below.
How well do the HE data correlate with the seasonal rainfall data that we examined earlier?
The correct answer is A.
Although the seasonal rainfall is given as a percentage of the normal rainfall over South Africa, the HE products compare well with the seasonal data. For example, over the Ermelo area, seasonal rainfall data have values up to 150% of normal, while the HE indicates that the area received over 300 mm of rainfall between 22 December and 21 January. Although these datasets deal with different values, the trend of heavy rainfall over the Vaal Dam catchment region remains constant throughout. This kind of information should be of concern to meteorologists on duty and keep them on alert.

Integrating the Data
Making the Forecast
We've examined various types of data for 21 January 2010. What do you expect to happen to the Vaal Dam catchment area in the coming days? Select all that apply, then click Done.
The correct answers are A, B, and C.
The low-pressure system over Namibia did, in fact, bring more rainfall over the region, leading to the flooding of the Vaal Dam. Soil moisture levels in the region were very high because of the persistent rainfall throughout January. The persistent rain and possibility of more rain from the tropical low mean create a situation that must be monitored very closely.
Taking Action
When flooding is possible, as it is in this situation, what should you do? What actions should you take? Select all that apply, then click Done.
The correct answers are A and C.
When flooding is possible, you should issue warning to regions in danger, using print, online, and broadcast media, as soon as possible. Being proactive is important; it's better to take action than to assume that someone else will do it. You should also contact the region's hydrological management structures and give them an early warning that more rainfall is expected in the region. Waiting for them to contact you would lead to the loss of valuable time and could undermine their ability to properly manage an emergency situation.
Combined 15-Day Rainfall Accumulation vs. Dam Percent Capacity
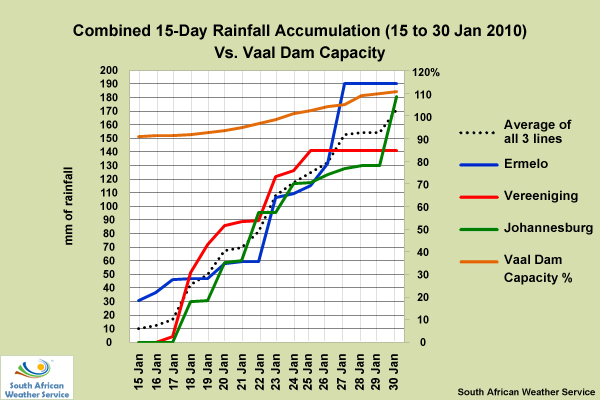
This rainfall accumulation vs. dam percent capacity graph shows what happened from 15 through to 30 January. When did the Vaal Dam reach 100% capacity? Choose the correct answer.
The correct answer is C.
The dam reached its capacity on 23 to 24 January. Because of the time lag between the next rainfall event and its arrival at the dam, the dam reached 110% of its capacity on 30 January.
Real-Time Vs. Predicted Percent Capacity of the Dam
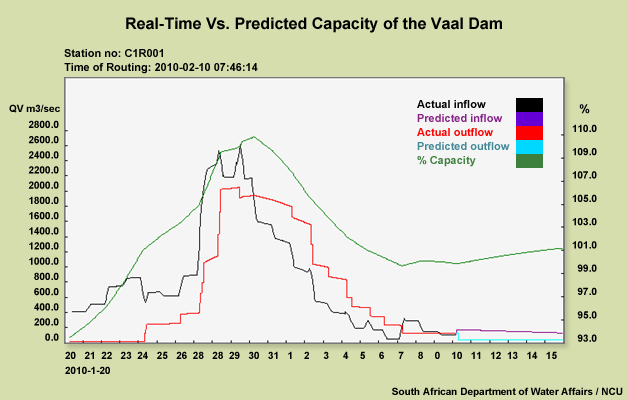
This hydrology graph shows actual and predicted inflow and outflow rates for the Vaal Dam and its percent capacity levels through 15 February. The actual figures go from 20 January to 10 February, while the predicted figures extend from 10 to 15 February.
Based on this information, when was it MOST critical to provide hydrological management structures with highly accurate forecasts of precipitation amounts, timing, and intensity?
The correct answer is A.
The correct answer is A. As the green line shows, the dam's percent capacity increased rapidly from from 94% on 21 January to 105% on 27 January. This means that as the volume of the dam increased, the dam was less capable of taking in more water. More rain was expected in the following days, which would increase already high ground moisture levels. Since the hydrological situation was expected to worsen considerably, hydrological management structures would need as much meteorological information as possible (possibly more than once per day) as quickly as possible. The situation from 27 to 31 January was also critical but the management structures would have been fully aware of the risks by this stage and taken the necessary safety measures. Note how conditions stabilized between 1 and 6 February, with the inflow of water into the dam decreasing steadily.
Conclusion
To summarize the situation, the Vaal Dam reached 100% capacity on 23 to 24 January. It peaked on 30 January from additional heavy rainfall. After that, inflow into the dam started to decrease. However, its percent capacity remained above 100% due to the natural delay in the rainfall's arrival at the dam.
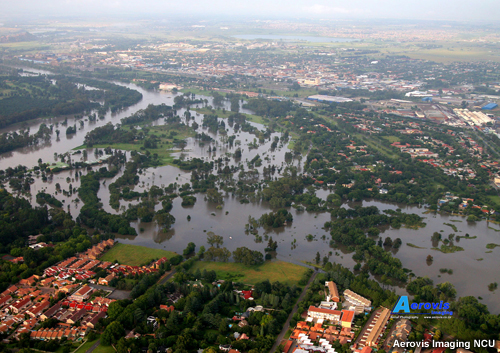
Flooding events such as this often have severe impacts on lives, property, and infrastructure. Roads and bridges are often damaged or washed away, and people lose their lives as they try to cross raging rivers. Although regular rainfall is mostly welcomed by the agricultural community, heavy and persistent rainfall events can leave fields waterlogged and crops ruined.
Soil Moisture Products
ASAR GM Soil Moisture Product
Soil moisture products provide important information for understanding the state of the land surface when rainfall is expected. When soil moisture values are high, the ground may not be able to absorb heavy rainfall. It usually becomes run-off, which can cause flash flooding in localized areas and increase the water level in broader regions. In this section, we will look at three soil moisture products: ASAR GM, ASCAT, and SMOS.
The ASAR GM soil moisture product has been developed within the scope of the SHARE (Soil Moisture for Hydrometeorological Applications) project. SHARE is an ESA DUE Tiger project that provides an operational soil moisture monitoring service for user communities such as the Southern African Development Community (SADC), Australia, and portions of Argentina. Using ENVISAT's ASAR sensor, SHARE provides frequent (up to twice-weekly) high-resolution measurements of regional soil moisture dynamics. In particular, the data demonstrate the level of saturation of the upper 3 cm of the soil layer, with the values ranging from 0 (completely dry) to 100 (saturated). For more information, see http://www.ipf.tuwien.ac.at/radar/dv/asar/.
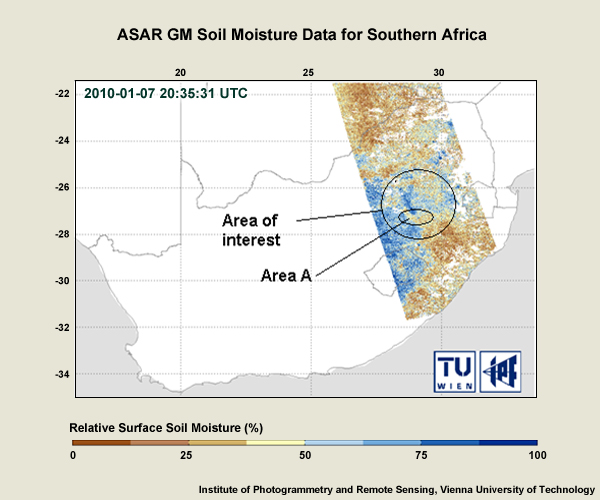
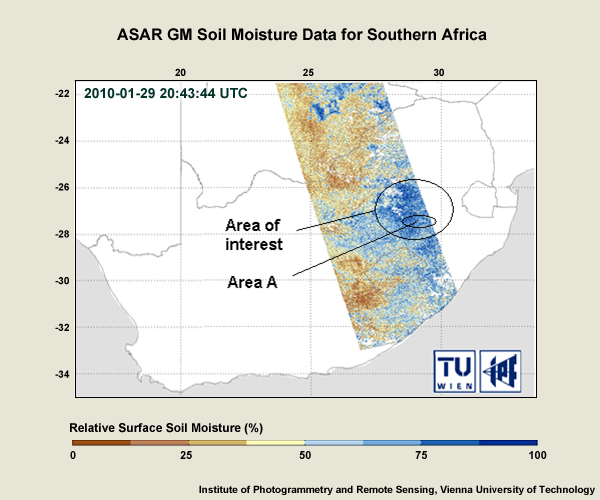
These ASAR GM soil moisture maps for the South African region show the percentage of soil moisture on 7 and 29 January 2010. On which day was Area A at a higher risk of flooding?
The correct answer is B.
The soil moisture values at area A ranged from 25% to 50% on 7 January and increased to 75% to 100% on 29 January. Clearly the area was at greater risk for flooding after 29 January if more rainfall hit the area, especially if it was heavy. You can see how ASAR GM data are useful complements to other types of data in heavy rainfall situations. Remember that whenever there's a risk of flash flooding, you should immediately issue a warning. Do so in consultation with the hydrological department if at all possible. If it's not possible, it is important to be be pro-active. Never assume that someone else will take care of the situation!
ASCAT Soil Moisture Product
Polar-orbiting satellites equipped with scatterometers (special microwave sensors) provide useful information about land surface conditions since they measure global soil moisture values. Polar orbiters have relatively coarse spatial resolution (up to 12.5 km), but they scan almost all regions twice daily, providing data on a relatively frequent basis.
The ASCAT scatterometer on the MetOp polar orbiter takes direct soil moisture observations, which are converted into soil moisture products. These are available from EUMETSAT twice a day. Many environmental fields make extensive use of these products, including meteorology and weather forecasting; water management and drought monitoring; and crop yield forecasting. The data are also used by early warning systems. For more information on the product, please visit: http://www.eumetsat.int/Home/Main/DataProducts/ProductNavigator/index.htm and search for ASCAT soil moisture.
Here's an sample ASCAT soil moisture product from February 2007 over Europe. It shows the moisture content of 5 cm of the topsoil layer in relative units ranging from 0 (dry) to 100% (saturated).
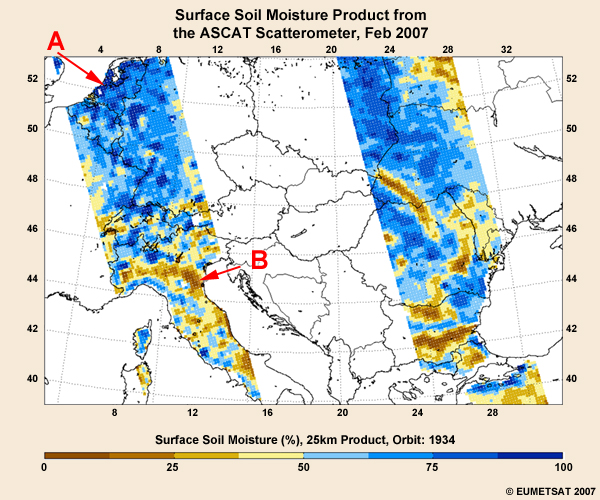
Which area has the highest soil moisture values and would be more prone to flooding if a heavy rainfall event occurred?
The correct answer is A.
Surface soil moisture values are at 100% in parts of the Netherlands, while the eastern coast of Italy has values between 0 and 25%. Based solely on this information, you can assume that areas with high soil moisture content are at a greater risk of flooding if a heavy rainfall event occurs.
SMOS Soil Moisture Product
The European Space Agency (ESA) Soil Moisture and Ocean Salinity (SMOS) mission supplies global observations of soil moisture over land. Assimilating surface moisture information into models results in better estimates of the water content in soil down to one to two meters, the area called the "root zone." Estimates of root zone moisture improve hydrological modeling and short- and medium-term meteorological forecasts, and are used to forecast floods, droughts, and other hazardous events. SMOS provides global maps of soil moisture every three days. These maps have a spatial resolution of 50 km and are accurate to within 4%. For more information on SMOS, see http://www.cp34-smos.icm.csic.es/smos_mission/smos_mission.htm
Flash Flood Guidance
SAWS Flash Flood Guidance System
As you'll recall, SAWS and the National Disaster Management Centre (NDMC) operate the South African Flash Flood Guidance (SAFFG) system. SAFFG incorporates meteorological and hydrological data and is based on the American system, which pre-calculates the amount of rainfall required in a basin for a river to overflow its banks.
SAFFG lets forecasters be very specific in their flash flood warnings as to which areas are at risk and/or need to be monitored. The system lets SAWS issue flash flood warnings to disaster management structures and the public, which can save lives and infrastructure.
If you work in a country with SAFFG or a comparable system, you should make full use of it and work towards improving early warning systems for flash flooding and flooding events. If a system is not available, you should find out where and how to obtain hydrological data and start integrating them with forecasting products. This will improve the quality and timings of warnings for flooding and flash flooding events.
Since the system was not operational at the time of the case, no data are shown for it.
Conclusion
From 1996 to 2010
If we compare the 2009/2010 Vaal Dam flood event to one that occurred in the same area in 1996, we can see how much has changed in a relatively short time.
In 1996:
- Meteorologists and forecasters relied on rainfall reports and communications with hydrological departments to understand how much rain had fallen and how the soil was reacting to it
- NWP models had much coarser temporal and spatial resolution
- Forecasters in South Africa could not overlay NWP and satellite data
In 2010:
- The range and quality of remote sensing products have improved vastly, based mainly on the upgrade from Meteosat First Generation (MFG) to Meteosat Second Generation (MSG) satellite imagery
- With 12 rather than 3 channels of data, MSG users have far more precise information about the atmosphere and land surface and have many more channels to manipulate and develop into multispectral products
- Many meteorological and hydrological products have been developed based on MSG imagery, including the hydro-estimator and soil moisture products; these products help today's forecasters more fully understand the factors that influence flash flooding in their regions
Recommendations
Having completed the module, we hope that you have a clear sense of the value of combining various types of data and information when dealing with possible flooding events. If you rely solely on hydrological or meteorological data, you will not have the holistic understanding of the state of the atmosphere and Earth’s surface required to, for example:
- Determine the amount of rain needed before flash flooding can occur
- Determine whether the buildup of soil moisture over a rainfall season can result in flash flooding, even with relatively low amounts of precipitation
Finally, we encourage you to do the following:
- Use the latest tools in conjunction with real-time data and other forecast products when dealing with potential flood situations
- Be familiar with how and where to gather hydrological data in your country or region. Research how best to combine these data with meteorological products so you have a full understanding of surface and atmospheric conditions at all times
- Share expertise and information about water management and predicted precipitation with hydrologists